

Tableau Tutorials: How to Create a Parameterized Table
Let’s say you’re planning to present a large table of information and you want the user to be able to filter based on the top or bottom X number of records. Due to the size of the dataset we would like the customer to have the ability to filter based on more than one column for their comparison. Making a large dataset much easier to digest. To keep this tutorial simple I will be using a basic randomly generated dataset as shown below:

Some of the sample dataset
Parameters and user input
By using parameters, we can take a selection from the user and make the dashboard display only this data. We will require three parameters to solve this problem from the example.
a) Number of Employees to display
b) Top or Bottom
c) Age or Salary
1) To do this right click on the lefthand data pane and select ‘Create parameter’
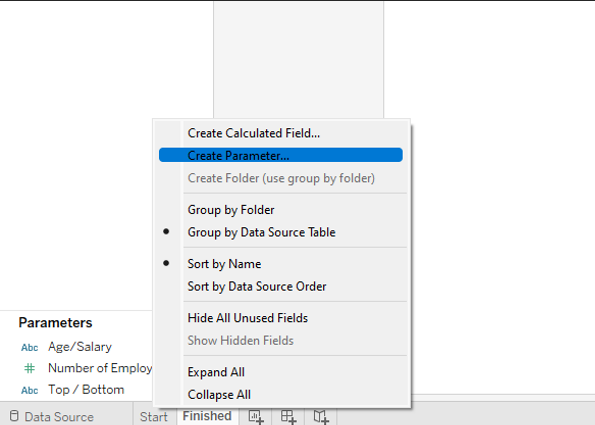
GUI showing the create parameter option
2) For the number of employees, we will select a range which will allow the user to select the number of employees from a predefined list. For our example this will be 5,10,15

Creating a parameter using a range of values
3) For the other two parameters we will use a list. Here we will type out the column names as they appear within tableau.

Creating a parameter using a list of values
And similarly for the Top/Bottom selector a parameter with these values: ‘Top’ and ‘Bottom’ is to be created. As above.
Calculated Fields
Next we will use of calculated fields to use the input from the parameter. When using a list parameter we can use the items in either a CASE or IF statement. Doing so will enable different logic to be applied based on the parameter value.
Within our example we are interested in selecting based on the top or bottom values within the data. Therefore I will use the MAX function and build logic around this. In practice this can be as complex as required.
1) First I create a switch based on my column logic.
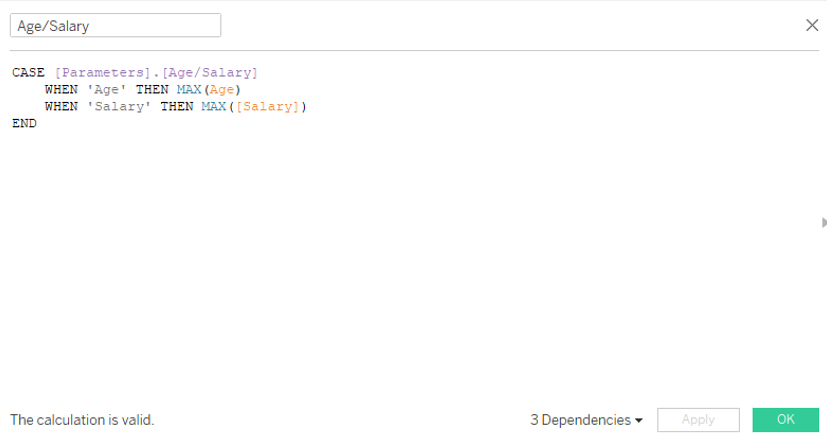
CASE statement selecting MAX of Age or Salary
2) Then use the calculated field Age/Salary above within another calculated field combining with the number of employees parameter to select these values.
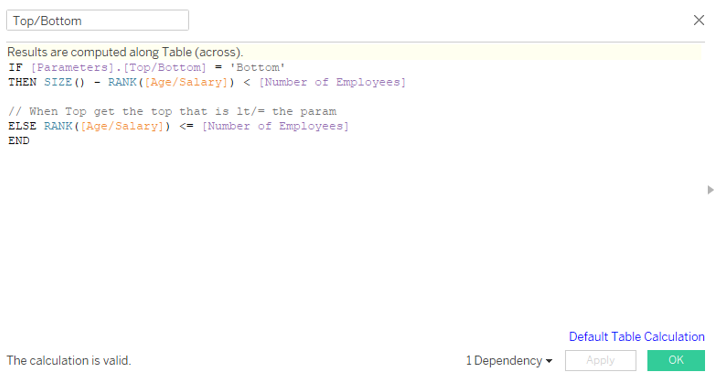
IF statement for top/bottom using a RANK function to return the position for sorting
For completeness these two above can be combined and all logic held within one calculated field if required. However, where possible I try and ensure that calculated fields are as simple as possible for maintainability. As you can see from the example below this may be slightly harder to read and if the logic needs updating it must be updated twice (in both when cases).
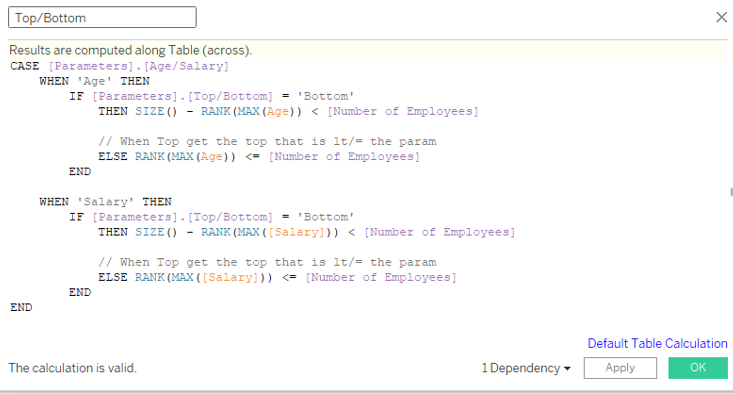
The result of this is a Boolean field which would give tell tableau if the row matched the criteria selected by the user between all columns and parameter values. Therefore, the last step is to now use this to filter the table.
3) Finally drag the newly created ‘Top/Bottom’ field onto the sheet filters, select only TRUE values.
Congratulations, you’ve created a truly dynamic table that allows your users to filter as they please. This was a very basic example but can be extended to allow for any number of columns or measures to be filtered.