

Identifying Upsell Opportunities
Building a pyspark classification model to identify upsell opportunities.

What is this article about?
This article will follow the process of using a classification model on a Kaggle dataset. The steps will include defining the business problem, cleaning the data, building and tuning a classification model and using the output to drive quantifiable business value.
Upsell in the retail industry refers to the practice of encouraging existing customers to purchase additional or upgraded products or services. This can be done through targeted marketing campaigns, personalized recommendations, and other strategies.
Machine learning can improve outcomes for existing customers by enabling more accurate and effective upsell efforts. For example, by analyzing customer data and identifying patterns in purchasing behavior, a machine learning model can make more accurate recommendations for products or services that a customer is likely to be interested in. Additionally, machine learning can be used to identify customers who are at risk of leaving, and target upsell efforts to those customers in order to retain them as customers. Machine learning can also be used to optimize pricing and promotions, to find patterns on customer's preferences and to personalize the communication with them, which can lead to increase sales and customer loyalty.
The Data
This dataset has been taken from Kaggle - Available here.
The dataset contains records of calls being made during a telephonic marketing campaign, where the success of the phone call (to upsell a term deposit) is recorded. There are several other features, including some details of the customer, balances and previous attempts at upsells. The aim is to successfully classify whether a customer is a potential upsell target or not, which allows businesses to more accurately target their marketing campaigns.
This dataset has imbalanced classes, there are significantly more negatives than positives (which makes sense given this is a telephone marketing campaign…) so this introduces a couple of issues. We want to ensure a stratified train-test split, to keep the same proportion of negatives and positives. We also want to deter the model from simply predicting the majority class (no) constantly.
Transforms
We use the below transforms to stratify the split and add a “weightCol” to mark the imbalance in classes, This will be used later by the classification model to punish majority guessing, as the training metrics will penalise false negatives more heavily.
Pipeline
Next we define our pipeline, creating our indexers/assemblers, setting some static parameters for our RandomForestModel and creating our classification evaluator. None of these steps are unusual, and would be present in most (tabular) pyspark pipelines.
Search Space
Now we define our search space. This spans the possible hyperparameter combinations we are going to try. Some of these parameter spaces are taken from popular tuning libraries, some are personal preference.
It’s always worth looking into the parameters being tuned a little, and setting reasonable search spaces. For instance, our dataset is relatively small (both rows and columns) so choosing arbitrarily large values for hyperparameters such as the number of trees or maximum depth is likely to lead to slow training and poor test performance (overfitting).
Objective Function
Then we set up our objective function, this is the function we’re looking to minimise, with respect to our inputs, in this case, the hyperparameter search space we’ve created. Here we’ve defined our loss to be the areaOVERroc, the complement of the areaunderROC, this is chosen as hyperopt minimises our loss output.
This means our model is having hyperparameters tuned with respect to the ROC metrics.
Trials
Then we call our hyperopt run. This will iteratively try new hyperparameter combinations from our search space. The algorithm choice of “TPE suggest” uses Tree of Parzen Estimators to suggest better hyperparameter choices at each trial. This allows for (typically) faster convergence than random/grid search approaches, although does not guarantee convergence nor monotonic improvement.
And that’s the training and tuning completed!
The classification algorithm produces an areaoverROC of ~0.07, meaning reasonable performance.
Diving into the confusion matrix clarifies this further - we can see about 1,300 misclassifications, of our 13,600 (test) records, this leaves over 12,000 correctly classified labels.
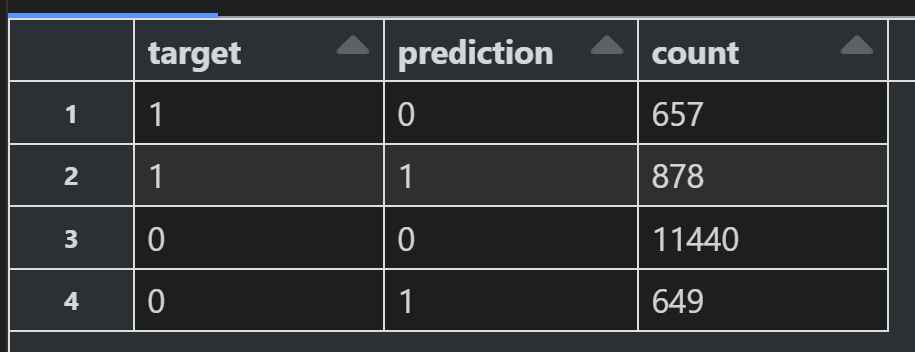
A confusion matrix of the test output. “Target” is the real label, “Prediction” is the model output.

Get there faster
Distil8 our Solution Accelerators get you there faster
But how has this helped us drive any business value?
Our initial dataset contained around 45,000 attempted upsells, with around 5,000 successes. Each trial costs both time, and money. Using this classification output, we would convert that list into 4,500, with just over 3,000 successes. This would push the marketing campaign to move toward the 60% success rate (up form 10%).
Our model was optimised on areaoverROC, a metric combining the 4 types of classification outputs, true positive, true negative, false positive, false negative. If we were concerned with the cost of a particular classification, a different metric would be chosen to optimise.
For example, if false negatives (predicting no, when the outcome is yes) is deemed too costly (missing out on a potential upsell), then “precision” would be optimised for, instead. This simple change (a single metric output) has significant impact on the training, final model configuration and business value derived from the output.
I hope this short article has been a helpful demonstration of building a classification model, and how even simplistic models can help achieve business-aligned objectives.