

10 Commonly Used Data Wrangling Codes Using Pandas And PySpark.

Why PySpark?
Do you already know Python and work with Pandas? Do you work with Big Data? Then PySpark should be your friend!
PySpark is a highly effective language as it enables data scientists to perform scalable data analysis, scalable machine learning, graph analysis, streaming and the creation of Machine Learning pipelines. PySpark is a Python API for Spark which is a general-purpose distributed data processing engine. It does computations in a distributed manner which enables the ability to analyse a large amount of data in a short time.
This article will demonstrate 10 commonly used codes to help you get started with data wrangling using both pandas and spark. The data wrangling codes will be demonstrated with Pandas and PySpark using the famous Titanic dataset. This article is geared towards people using Databricks but can be used on other IDE like Jupyter notebook.
NOTE: If PySpark has already been installed, before running the PySpark codes on any other IDE apart from Databricks, remember to add and run this chunk of code at the very first cell:
These are some additional imported libraries and routines needed to perform the tasks shown in this article.
1. Importing Dataset
Databricks makes use of hive, and the Titanic data was first uploaded to its hive storage. In Databricks, only Spark can be used to import datasets from a hive table. That is why the dataset was first imported using Spark and then converted to Pandas as a separate DataFrame.
Once the datasets have been imported, we would want to view the imported DataFrame.
2. View data in DataFrame
The code below unveils the imported dataset. The display command also works in Spark to display a DataFrame.
SPARK RESULT

PANDAS RESULT

You may decide you only want to see the number of rows and columns in your dataset.
3. View number of columns and rows
In Pandas the ‘shape’ of the DataFrame can easily give the count of rows and columns. Spark doesn’t have a single command to obtain the rows and the columns. To recreate the ‘shape’ command in Pandas, you would need to use the ‘count’ and ‘columns’ commands as shown below. Another way around it could be to convert a Spark DataFrame to Pandas (using the toPandas command used previously) and use ‘shape’ to display the number of rows and columns.
RESULT

Both have the same output
Now that we know the number of rows and columns, we can then view the names of the columns.
4. View column names
To view the column names; the command df.columns works for both Spark and Pandas.
SPARK RESULT

PANDAS RESULT

After viewing the names of the columns, we can check the data types of the columns next, to confirm they are all correct.
5. Display column datatypes
The code df.dtypes works for both Spark and Pandas to view the datatypes of columns. The data types could be strings, objects, integers, etc.
If the column type for ‘Name’ is ‘integer’, this indicates that no names are given in this column. The column ‘Name’ should have type ‘string’ if it contains names. since integers are used for columns with numbers.
SPARK RESULT

PANDAS RESULT

The data type of the columns in the Spark DataFrame is strings while that of Pandas is object. Columns with string data types have a fixed length in bytes, whereas object columns are strings with varying lengths.
Viewing the schema of a DataFrame will also display the data types of the columns in that DataFrame.
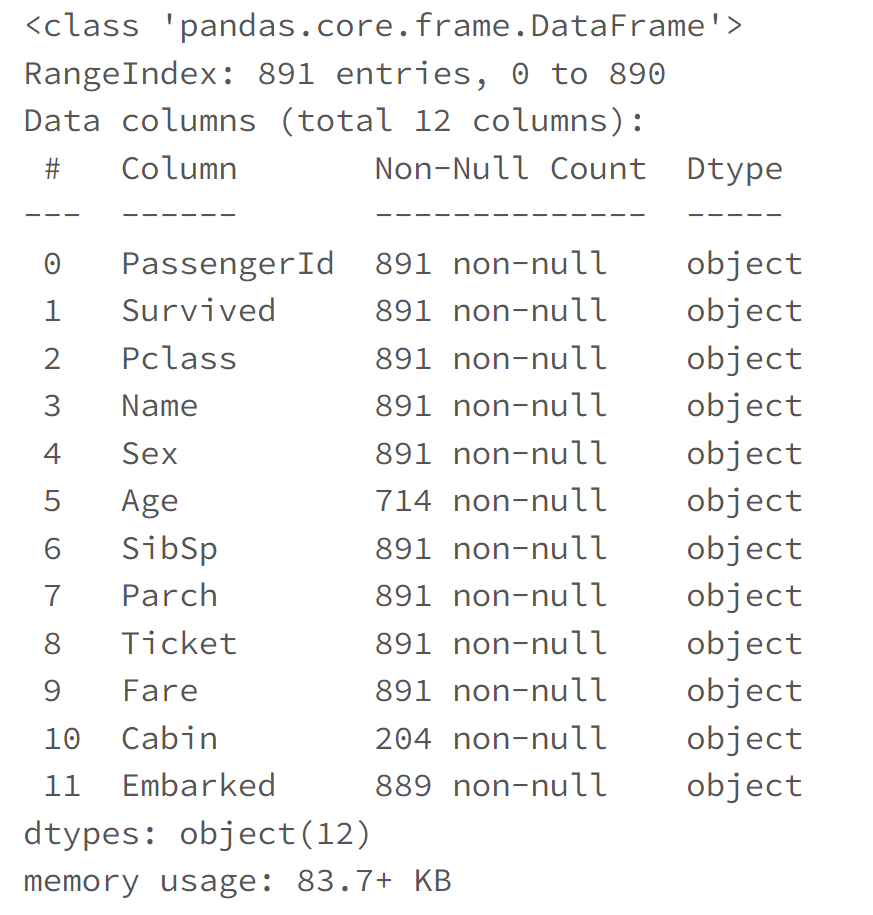
6. Display DataFrame schema
When viewing the schema you get information about the column names, column data type, non-null values and Pandas memory usage.
SPARK RESULT

PANDAS RESULT
Let's view the number of missing values in the DataFrame.
7. Missing data in a column
In Spark, the number of null values in each column can be determined by: First, filtering using the isNull command and then using .count. Pandas use a similar approach using ‘sum’ instead of ‘count’.
SPARK RESULT

PANDAS RESULT

There are different methods to handling null values, depending on the type of data, kind of analysis or purpose of data usage. While some may prefer to remove null values from their dataset, some people may use other methods to fill the rows with null values.
8. Renaming a column in a DataFrame
When renaming columns in Spark, the command .withColumnRenamed is used (take note of the capital C and R in withColumnRenamed). In Pandas .rename is used instead.
Here the column ‘Name’ has been changed to ‘PassengerName’.
SPARK RESULT

PANDAS RESULT

9. Get unique values of a column
The ‘distinct’ command is used to view unique values in a column in Spark while ‘unique’ is used in Pandas.
The code below displays the distinct values in the ‘survived’ column. The column contains just 2 values which are 0 and 1 which symbolises people who survived and people who did not survive in the Titanic dataset.
SPARK RESULT

PANDAS RESULT

10. Pivoting
Pivoting can be used to restructure a DataFrame, such that the rows can be converted into additional column headings where a chosen column is displayed in these new column headings. Pivoting aids data understanding and presentation.
The dataset looks like this before pivoting.

Here the sex column is pivoted and age is used as the value.
SPARK RESULT

PANDAS RESULT

Pivoting the sex column also sorts the result in alphabetical order.
CONCLUSION
Some or all of these basic codes may be helpful in handling your data wrangling tasks. It may seem that some of the Pandas codes look simpler than that of Spark but when handling a large dataset, you can run into memory issues. It would be better to make use of the power of clusters Spark offers to handle data analysis and data wrangling. Spark can also speed up the performance of the notebook. This is my first blog and I hope you find this useful. If you have any comments, please feel free to get in touch.