
An Introduction to SunBeam
SunBeam™ is a data modelling approach established at Advancing Analytics by our resident Power BI expert and all-round analytics aficionado Johnny Winter.
What’s in a name?
SunBeam™ is a method for gathering data modelling requirements for analytical data models which takes its name from the combination of two existing data modelling methods, Sun Modelling and BEAM*. Using the strengths of each to enhance the data modelling experience for stakeholders beyond the data team.
What is Sun Modelling?
Sun Modelling is at present a relatively niche technique for requirements gathering for analytics systems and is spread largely via word of mouth. Looking the term up in your browser will more likely present you models or diagrams of our solar system’s resident star than the technique we are discussing here.
Sun Modelling was a technique initially developed and taught by Mark Whitehorn as a professor of analytics at the University of Dundee. Which is where our own Terry McCann encountered the approach whilst studying for his MSc. He does a great talk on the topic in this video.
A core aim of the method is to offer a simplicity that makes it accessible to end users as well as the usual technical professionals. The approach is a high-level visual means to model data around a business process.
An example Sun model is pictured below followed by some explanation.

At the heart of our Sun Model we start with our quantitative ‘measures’ which apply to a business process. Given the example of a sales transaction process, we may for instance want to see the profit margin, the unit quantity and the unit cost.
From the central circle there are lines out to the objects that we want to slice and group our central values by, one such object which is a given is date, to answer the question when did an event happen. You may also want to group by customer to determine spending patterns or by product to see which lines are selling best.
These objects will be our dimensions when translating this model into a fully-fledged Entity Relationship Diagram (ERD).
On the lines out to our dimensions we then create branches to cover some of the attributions we may wish to see. For a Product it may be the brand or colour, for a customer it may be their name or age and for a Date we may want to know the quarter or week number.
A core concept here is the representation of hierarchies using a single straight line from the centre to the dimension to indicate the hierarchy starting at the lowest grain and working up, i.e. Day, Month, Quarter and Year for the Date dimension.
Another rule with Dimensions in Sun Models is that all measures at the centre must be sliceable by each dimension, if not then a new model is needed.
What is BEAM*?
First things first, let’s make sure BEAM* doesn’t become another ingredient for the Acronym soup!
The abbreviation stands for Business Event Analysis Modelling. As for the Asterix at the end, this isn’t a typo, the symbol is included to represent the ‘dimensional deliverables’ of this approach (long live the star schema!).
BEAM* is defined within ‘Agile Data Warehouse Design’ by Lawrence Corr as ‘an agile data modelling method for designing dimensional data warehouses and data marts.’. The book goes on to define BEAM* as ‘a set of repeatable, collaborative modelling techniques for rapidly discovering business event details’
We are big fans of BEAM* at AA and highly recommend adding this book to your reading list.
However, to summarise the approach, BEAM* comprises of 3 D’s and 7 W’s which we will go into next.
The 3 D’s
Discover, this is the act of working with the business to discover any business event which you may want to measure and report against.
Describe, starting with a BEAM* table which holds exemplar data for an event, we then start to ask the 7 W’s. In doing so we start to build a greater picture of what the event involves and what we need to be able to capture.
Document, the final step is committing what we have determined in the first two steps to an artefact which can be used as a specification. Taking the BEAM* table with the worked questions we can then persist these in a tabular data model.
The context of the 3 Ds in a session held with stakeholders is largely to signpost the session for all parties involved. It’s a chance to set the context of what you’re looking to achieve how each step will fit in to this.
The 7 W’s
Before we list these out, we should note a couple of the ‘W’s’ are a little tenuous, they contain the letter W but not as the leading letter.
Who: The who’s within a given process, it will often be a customer or client but also the actors from within the business or suppliers who provide the goods or services.
What: The what question is generally aimed at the topic of the event, it could be products or services.
Where: The where question is interesting as a single business process may have multiple where’s, it could be the where for the centre that sold the goods, or where the goods will be dispatched from, or where the order is being sent to.
When: This question is more or less a given and the answers will be the important times and dates within the business event. That means the question needs repeating for instance when an order was made, when was the order dispatched, when was the order received.
Why: This question isn’t always an obvious one to answer, in a sales situation the why may be because there was a promotion, or perhaps external factors such as a weather warning driving up the sales of snow shovels.
How: This is another question that can be a challenging one to answer and may not always fit an event. An example of a How in a sales transaction may refer to the commerce journey, for instance was this E-comm or direct sales.
How Many: The How Many question is where we define our facts, we establish any quantitative values we would like to capture in the given event, i.e. number of orders, profit margin or sales quantity.
The 7 W’s are intended to encourage stakeholders to think about their business events in a dimensional manner, even if they aren’t necessarily familiar with dimensional modelling.
This means that the onus of BEAM* sessions is on the facilitator to encourage stakeholders to answer these questions and keep driving into the detail of each.
BEAM* tables are used to clarify the process for stakeholders, using exemplar data to show stakeholders what an event looks like in data and asking the 7 W’s to determine which values hold dimensional requirements.
Bringing it together
SunBeam™ is a modelling approach which combines elements of the two above methods.
The Primary element taken from the Sun Models is the aesthetic of the output, we want to create something that visually clarifies the relationships between facts and dimensions and indicates the rollups and hierarchies within the dimensions as well as discovering the attribution that matters.
The result is a really high-level view of a fact and its dimensional relationships but in a way that makes sense to stakeholders with varying degree of technical knowledge.
From BEAM* we can use the 3 D’s to signpost and contextualise the session before asking the questions laid out in the 7 W’s. With SunBeam™ being a new approach, we also introduce an 8th W, How Often. This a question of the cadence of the business event, how often does it happen, how often is it captured and recorded.
The aim of a SunBeam™ session is to guide stakeholders towards documenting their requirements for reporting on a given business event.
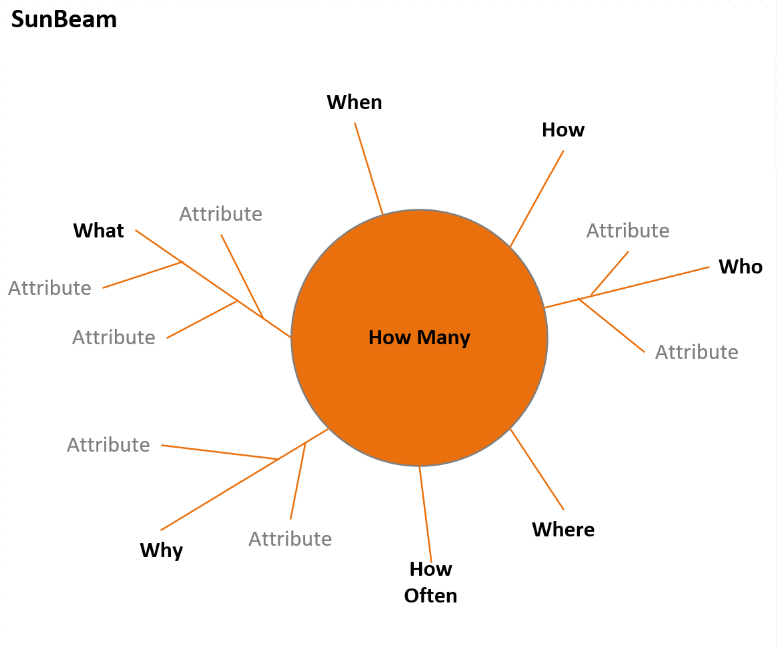
An important thing to bear in mind is given that the ‘How Many’ question generates our Facts, we need to ask this first. So given the context of a business event we ask the question to establish those quantitative values we want to report on.
We can then ask each of the W’s in turn, taking as many passes as it takes to hit dimensional bedrock. It is worth working a single W as fully as possible in terms of the attribution but don’t get so bogged into the detail of a dimension that it hinders the wider process.
SunBeam™ is a real time collaborative session which means as you ask these questions you need to be documenting the responses for the stakeholders to see. As the model takes shape before their eyes this will prompt further ideation on the possibilities and relationships.
A graphical representation of SunBeam™ can be seen below.
Top tips to maximise SunBeam sessions
Invite a broad range of stakeholders relevant to a process, as someone in finance may have a different view on the process than someone within a marketing team. This also helps to clarify some differences that may exist in the language that professional groups use and feeds this information back into the semantic model.
It’s important to ask the 7Ws multiple times as often there is more than one answer for a given W. However, there may on occasion be no answers for some of the questions, don’t worry this isn’t a failure of the process but by asking the question you can be sure it is omission by design.
You should always create one sun model per event, even if two events share similar dimensions and even measures, they should each have their own model.
Another important tip is don’t get bogged down in what people already know about their data, these sessions should be seen as an aspirational exercise. Just because you don’t currently have a value it shouldn’t stop you talking about how it would be useful and how you might look to achieve it in the future.
The resultant models are not the finished or fixed design, the output is a target to strive for but may change during implementation.