

This article originally appeared on Medium.com. It has been republished with permission from the author.
Monitoring infrastructure is essential for keeping production workloads healthy and debugging issues when things go wrong. Observability is essential for troubleshooting.
The goal of this post is to learn how to quickly and easily deploy a minimal configuration open-source Prometheus and Grafana monitoring infrastructure in Kubernetes.
The full yaml for the examples discussed can be found on the github repo here.
The Prometheus ecosystem continues to improve; the Prometheus operator and associated bundled project, while promising, are still in beta and improving their usability. Docker containers makes these applications particularly easy to run and configure, and Kubernetes adds additional resilience.
The target audience for this post has a basic understanding of Kubernetes and is new to Prometheus/Grafana. I focus here on a simplistic deployment in order to illustrate how these applications work together and give examples of how Kubernetes concepts create useful building blocks.
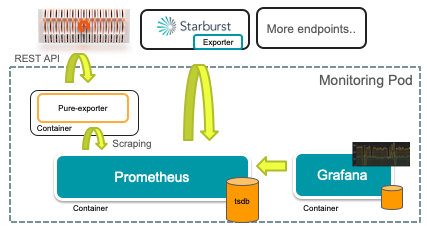
There are three necessary services in our monitoring setup:
- Prometheus endpoint(s). This is the application with metrics that we want to track and can either be done natively in the application or through an exporter.
- Prometheus, a monitoring system and time-series database.
- Grafana, a visualization tool that can use Prometheus to create dashboards and graphs.
The software stack I use includes Kubernetes v.1.18.2, Prometheus v2.18, and Grafana v7.
Overview: A Standalone Monitoring Pod
Getting started with tools like Prometheus can be daunting, therefore my goal here is to walk through a simple, standalone monitoring deployment to illustrate the necessary components in one single yaml file. This can then be used as a foundation for a more sophisticated Prometheus setup.
This walkthrough assumes a basic understanding of Kubernetes components: Services, Deployments, Pods, ConfigMaps, and PersistentVolumes. After reading, you should have a better understanding of both Prometheus and when to use each Kubernetes component.
A quick overview of the components of this monitoring stack:
- A Service to expose the Prometheus and Grafana dashboards.
- Deployment with a pod that has multiple containers: exporter, Prometheus, and Grafana.
- Configmap that stores configuration information: prometheus.yml and datasource.yml (for Grafana).
- PersistentVolumeClaims to make Prometheus metrics and Grafana dashboards persistent.
Service
We start with a Service to expose the UI ports for both Grafana (3000) and Prometheus (9090). Use this service in conjunction with port-forwarding or a load balancer to make it easy to login to the either service.
apiVersion: v1
kind: Service
metadata:
name: monitor
labels:
app: monitor
spec:
clusterIP: None
ports:
- name: graf-port
port: 3000
- name: prom-port
port: 9090
selector:
app: monitor
Deployment
We then create a Deployment with a single pod. That single pod contains multiple containers, one each to run Prometheus and Grafana, so this architecture highlights the difference between a pod and a container. Effectively, the Deployment/pod combination is that logical unit by which Kubernetes manages the application: containers within a pod are scheduled together and restarted together. Splitting each into a separate pod creates more robustness, but I focus on a single pod to keep the interconnections between applications simpler.
Container 1, Prometheus.
This first container defines how to run Prometheus, using the public Docker image and linking to a config file that will be defined later.
spec:
containers:
- name: prometheus
image: prom/prometheus
args: [“--config.file=/etc/prometheus/prometheus.yml”]
ports:
- containerPort: 9090
name: prom-port
volumeMounts:
- name: config-vol
mountPath: /etc/prometheus/prometheus.yml
subPath: prometheus.yml
- name: prom-data
mountPath: /prometheus
imagePullPolicy: Always
This container spec mirrors the Docker instructions for starting Prometheus, with straightforward translation of Docker arguments to yaml config. Compare the above yaml with suggested Docker invocation:
docker run -p 9090:9090 \
-v /tmp/prometheus.yml:/etc/prometheus/prometheus.yml \
prom/prometheus
The only difference here being an additional volume for the persistent data so that the time-series data is retained upon restarts.
Container 2, Grafana.
The Grafana container specifies analogous elements as Prometheus: a port mapping, a configuration file, and a volume for persistent data. Again, there is a direct correspondence between this yaml and the basic docker run invocation.
- name: grafana
image: grafana/grafana
ports:
- containerPort: 3000
name: graf-port
volumeMounts:
- name: config-vol
mountPath: /etc/grafana/provisioning/datasources/datasource.yml
subPath: datasource.yml
- name: graf-data
mountPath: /var/lib/grafana
Volumes
Kubernetes volumes provide data to containers and have different possible sources. In other words, containers need to use many different types of data, so volumes provide the abstraction to connect data to containers in various ways. For example, ConfigMaps are great for small, read-only configuration data, whereas PersistentVolumes are more flexible for larger, dynamic datasets.
The Pod spec defines three volumes: one for the configuration files for both services, and one each for the persistent storage for Prometheus and Grafana. These volume definitions instruct Kubernetes how to connect the underlying data sources to the volumeMounts in each container. ConfigMaps and PersistentVolumeClaims are mounted in the containers above the same way.
The three volumes are:
volumes:
- name: config-vol
configMap:
name: monitor-config
- name: prom-data
persistentVolumeClaim:
claimName: prom-claim
- name: graf-data
persistentVolumeClaim:
claimName: graf-claim
The two types of sources of these three volumes, ConfigMaps and PersistentVolumeClaims, will be described next.
Volume type 1: ConfigMap
A ConfigMap stores text data that can be used as configuration files inside a container.
The data section of the ConfigMap contains two different entries, prometheus.yml and datasource.yml. The previous Volumes map these to configuration files for Prometheus and Grafana respectively.
kind: ConfigMap
apiVersion: v1
metadata:
name: monitor-config
data:
prometheus.yml: |-
global:
scrape_interval: 30s
scrape_configs:
- job_name: 'replaceme'
datasource.yml: |-
apiVersion: 1
datasources:
- name: Prometheus
type: prometheus
Note in the datasource.yml configuration, Grafana connects to Prometheus via localhost (127.0.0.1), a simplification made possible by running both containers in the same Pod.
Volume Type 2: PersistentVolumeClaims
PersistentVolumeClaims enable persistent storage for both Prometheus and Grafana. The result is that both metric data and dashboards persist even with restarts. I leverage an already-installed Pure Service Orchestrator (PSO) to persist these volumes on a FlashBlade via the “pure-file” StorageClass.
kind: PersistentVolumeClaim
apiVersion: v1
metadata:
name: prom-claim
labels:
app: prometheus
spec:
storageClassName: pure-file
accessModes:
- ReadWriteOnce
resources:
requests:
storage: 1Ti
---
kind: PersistentVolumeClaim
apiVersion: v1
metadata:
name: graf-claim
labels:
app: grafana
spec:
storageClassName: pure-file
accessModes:
- ReadWriteOnce
resources:
requests:
storage: 100Gi
These PersistentVolumesClaims are required to make this monitoring setup persistent and therefore able to handle pod restarts and failures without losing data.
Usage
To use this setup, login to either Grafana to create dashboards or Prometheus to view scraping status. I use port-forwarding to make both services accessible outside my Kubernetes cluster.
Access Grafana dashboard by setting up port-forwarding and then pointing a browser to “hostname:3000”
kubectl port-forward ---address 0.0.0.0 service/monitor 3000
Once Grafana loads, you can skip “Adding your first data source” because the datasource.yml entry in our ConfigMap pre-configures the Prometheus data source for Grafana. Instead, go directly to creating a dashboard.
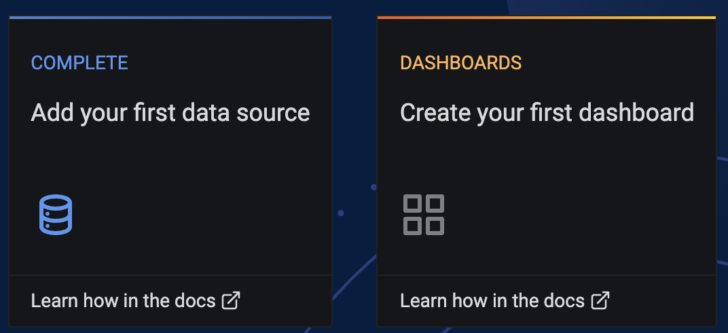
To start creating a custom dashboard, click “Add New Panel.”
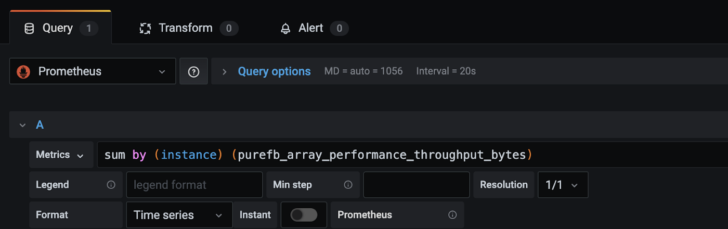
Start working with Prometheus queries by selecting “Prometheus” from the drop-down list of data sources.
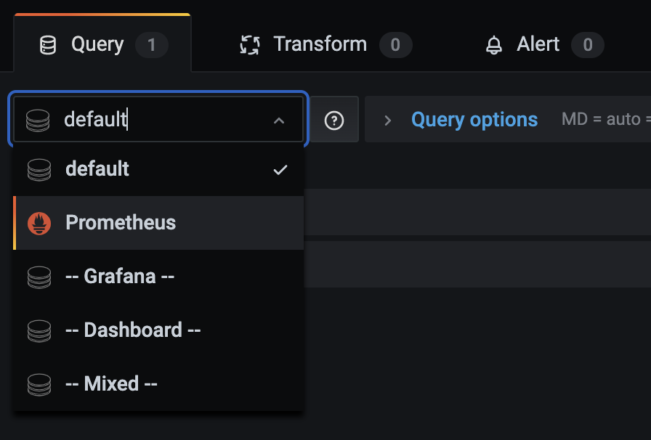
Then begin creating Prometheus queries (using PromQL):
You can also directly access Prometheus via port 9090 in order to monitor the scrape status for each target.
We have now set up everything except the actual endpoints to monitor, but fortunately this is relatively easy.
Example 1: Monitor Kubernetes
The first example will deploy Prometheus and Grafana to monitor Kubernetes itself. Kube-state-metrics is a service that listens on the Kubernetes API server and translates to a Prometheus endpoint.
First, install kube-state-metrics to deploy the monitoring service for Kubernetes.
> git clone https://github.com/kubernetes/kube-state-metrics.git
> kubectl apply -f kube-state-metrics/examples/standard/
Next, to connect our monitoring stack to this service, add the following to the prometheus.yml entry in the above ConfigMap:
scrape_configs:
static_configs:
- targets: ['kube-state-metrics.kube-system:8080']
Once configured, I can then start using PromQL to query metrics. For example, I can check per-node CPU resource limits:
sum by (node) (kube_pod_container_resource_limits_cpu_cores)
Example 2: Starburst Presto
The next example uses the same stack to monitor an application that exposes a Prometheus endpoint. I will use the Starburst Presto operator as an example.
The only addition necessary to the previous example is a job config for Prometheus that connects to the target Starburst service’s built-in Prometheus endpoint.
scrape_configs:
- job_name: 'starburst-coordinator'
static_configs:
- targets: ['prometheus-coordinator-example-presto:8081']
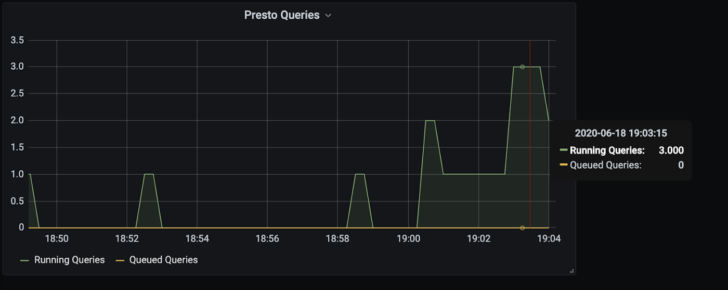
I can then plot interesting metrics, such as “running_queries” and “queued_queries” easily in Grafana:
Example 3: Pure Exporter
The third example builds upon the Pure Exporter, which is an external exporter for Pure FlashBlades and FlashArrays. This exporter is a Prometheus endpoints that runs as a container and collects results from Pure’s REST APIs. In other words, the exporter is a gateway that scrapes the Pure API and enables easier management of Pure FlashArrays and FlashBlades, including per-client statistics.
I incorporate this stateless external exporter into the same pod as Prometheus and Grafana. The result is three containers working together to collect, store, and visualize metrics. The pure-exporter can also run in a separate pod, but I chose this option because it simplifies my Prometheus configuration by being able to always access the exporter through a localhost address.
The full yaml definition can be found here.
The only change required to our initial framework is to add an additional “pure_flashblade” job to the prometheus.yml definition. The places to add specific information about each FlashBlade endpoint are marked with “REPLACE” in the snippet below:
scrape_configs:
- job_name: ‘pure_flashblade’
scrape_timeout: 30s
metrics_path: /metrics/flashblade
relabel_configs:
- source_labels: [__address__]
target_label: __param_endpoint
- source_labels: [__pure_apitoken]
target_label: __param_apitoken
- source_labels: [__address__]
target_label: instance
- target_label: __address__
replacement: 127.0.0.1:9491
static_configs:
- targets: [ MGMT_VIP ] # REPLACE with FB Management IP address
labels:
__pure_apitoken: T-token-secret # REPLACE
- targets: [ OTHER_MGMT_VIP ] # REPLACE OR REMOVE
labels:
__pure_apitoken: T-different # REPLACE
To obtain the management token for a FlashBlade, login and use the following CLI command:
pureadmin [create|list] --api-token --expose
Once configured to collect metrics, you can quickly build dashboards by starting with pre-configured dashboards. You can copy-paste the json definition from Github to Grafana, but I prefer to download the raw json file for a dashboard to my local machine.
To import a dashboard in Grafana, click on the “+” and then “Import” in Grafana.
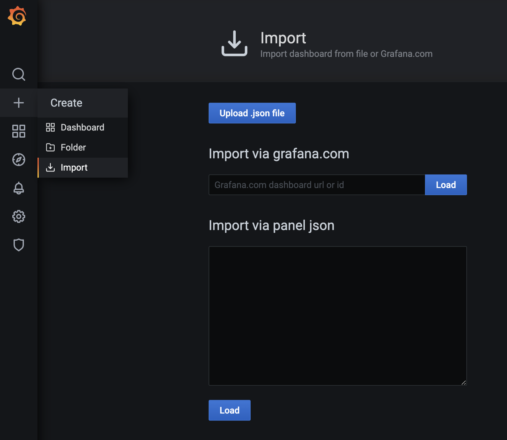
After loading the json dashboard definition, the import dialog box requires you to select the data source “Prometheus,” which connects back to our previously configured Prometheus server.
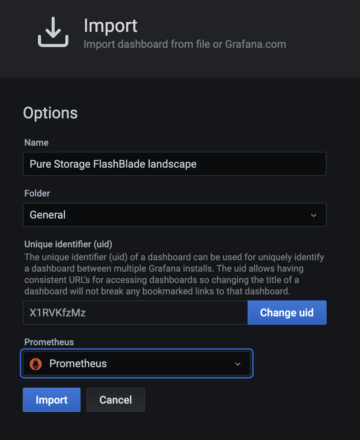
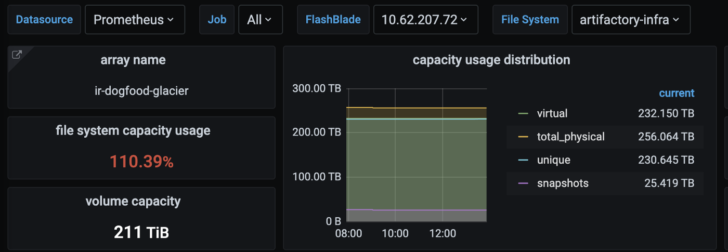
You now have a working dashboard for monitoring your FlashBlade or FlashArray and can further add on graphs as desired.
You can also combine all three examples in a single prometheus.yml config to monitor Prometheus, Starburst, and the FlashBlade with the same stack!
Summary
The full yaml for these examples can be found on the github repo here.
The objective here was to describe the minimal setup necessary to build a persistent monitoring stack in Kubernetes with Prometheus and Grafana and understand how they interact. This scaffolding demonstrates how to configure these services as well as providing a useful starting point to quickly create a monitoring system. After learning the basics of Prometheus monitoring, you can start using the Prometheus operator, build more dashboards, and incorporate alertmanager.
Up Next: Crisis, Culture, and the Cloud: A Fireside Chat with Workday’s Global CTO
![]()