
Risk Management Process – Part 3d: Risk Map and Risk Assessment Output
So far, we have covered risk identification, risk analysis, and risk controls. All these steps will be used to create a risk map.
What Is a Risk Map?
The risk map is the final component of risk assessment, providing a visual representation of the identified risks, their probability of occurrence, and their potential impact. It illustrates the risk profile of the organization at a specific point in time, a profile that will evolve over time as new risks are identified and/or controls are put in place to mitigate some of them.
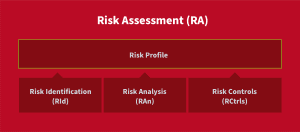
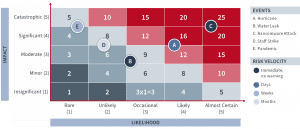
The risk map is typically represented in a graphical format that displays the identified risks on a grid, with the likelihood of the risk occurring on one axis and the potential impact on the other. Each risk is then assigned a score based on its likelihood and impact, with high-risk items located in the upper-right quadrant of the map.
By reviewing the risk map regularly, organizations can identify any changes in the risk landscape and adjust their mitigation strategies accordingly. The risk map can also be shared with stakeholders and other interested parties to ensure that everyone has a clear and concise understanding of the organization’s risk landscape.
The Importance of a Risk Map
The risk map is a vital component of risk assessment. It enables organizations to visualize and comprehend their identified risks, which is crucial in prioritizing and developing effective mitigation strategies. It provides a clear, concise, and easily understandable view of the organization’s risk landscape, which is vital for maintaining business continuity and protecting the organization’s assets and operations.
Without a risk map, a lack of visibility into the risk landscape may result in reactive rather than proactive risk management, which can lead to higher costs and greater impacts.
Example of a Risk Map
A risk map is a visual representation of the identified risks and their associated likelihood and impact.
For example, an organization may identify that the likelihood of a data breach is probable, and the potential impact is severe. Using a risk map like the one seen below, the organization can assign a high score to this specific risk, which will prioritize it for immediate action. The organization can then move to develop mitigation techniques, such as implementing data encryption, access controls, and employee training, to reduce the likelihood of a data breach and minimize its impact if it occurs.
What Is the Output of a Risk Assessment?
The four-step risk assessment process will help organizations gather and analyze information on their risk landscape. Risk assessment produces a number of highly valuable documents:
Risk Register
The risk register is a list of all identified risks, along with their scores, organized by category. It lists risks associated with a project, enterprise, or business unit. The risk register includes the risk category, the likelihood of each risk becoming a threat or event, the potential consequences of each risk event occurring, the costs to mitigate each risk, and the specific steps required for appropriate risk mitigation.
Ranked List of Risks
Another crucial output of a risk assessment (through risk analysis) is a ranked list of risks determined by the risk assessment team. This list prioritizes high-risk areas, helping organizations allocate their resources effectively. Risks are ranked based on their likelihood and potential impact, and the team determines which risks require immediate attention.
Risk Map
A risk map is a simplified visual tool that represents an organization’s identified risks in a clear and easy-to-understand manner. It displays the likelihood and potential impact of each risk, providing a concise view of the organization’s risk landscape.
For instance, in a hurricane scenario, the risk map may display the likelihood of a hurricane hitting the area and the potential impact on the data center’s operations. Similarly, in a cyberattack scenario, the risk map may show the likelihood of a ransomware attack and the potential impact on the organization’s data and systems.
Risk Control
The risk assessment process recommends risk control strategies for the highest-scoring risks. These strategies assist organizations in mitigating the impact of disruptive events.
For instance, in a hurricane-DC scenario, the risk control recommendations may involve fortifying the data center to withstand high winds and floods and installing backup power generators. In the case of a ransomware cyberattack scenario, risk control recommendations may include installing security applications, implementing backup and recovery protocols, and providing employees with training on how to identify and prevent cyberattacks.
After a Risk Assessment: the Next Steps
Once the risk assessment is completed, all the assessment documents must be reviewed and evaluated to determine the next steps in the risk management process. Various levels of management will review the documents, with the executive team performing a final review on the most critical risks that demand significant investments and fall outside the organization’s risk appetite and tolerance.
The first step in the review process is to present the output to the appropriate management teams, who can provide their insights and feedback. The goal is to ensure that the identified risks align with the organization’s objectives and strategies, as well as its overall risk appetite and tolerance.
After management review, the output is presented to the executive team for their final review and approval. The executive team’s role is to assess the risks’ potential impact on the organization’s objectives and strategies and decide on the appropriate course of action.
This is what we are going to review in our next installment. Stay tuned!